ECG R peak detection in Python: a comparison of libraries

For decades now, electrocardiography (ECG) has been a crucial tool in medicine. And with wearable ECG devices making their way into clinical settings, the amount of ECG data available will continue to increase1. Automatic detection of heart beats (R peaks, QRS complexes) is an important step in ECG analysis. In this post, we will compare some of the libraries you may come across when looking for a ready-to-use solution in Python. We will look at how these libraries can be applied, how well they perform and how fast they compute.
TL;DR
If you are simply looking for an easy solution to find heart beats in ECG signals, here are usage examples of the three libraries I would recommend. Continue reading below, to see why I prefer them over other (perhaps more popular) options.
Detecting R peaks in Python
|
|
|
|
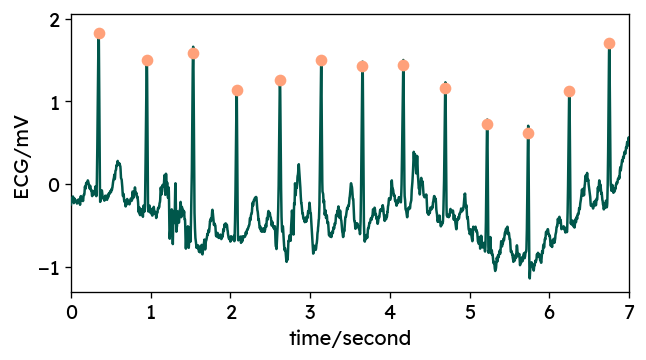
You can also use the WFDB package2 to visualize the segmentation.
|
|

Fine-tuning R peak locations using WFDB
Due to some internal preprocessing by most chosen methods, the resulting R peaks
typically do not perfectly coincide with the actual local maxima in the ECG
signal.
For most applications, this is not really an issue, as you are more
interested in the distance between consecutive peaks, i.e. heart rate.
If actual peak locations are important for your application, you can use
peak correction methods offered by some packages such as
BioSPPy’s correct_rpeaks or
WFDB’s correct_peaks.
For example:
|
|

Python packages for ECG analysis
When looking for a ready-to-use Python implementation of R peak detection, you come across a variety of options to choose from. Here is a list of packages with functions for ECG signal analysis. Please note that this is not an exhaustive list - there’s a high chance I missed a few:
neurokit2heartpy- primary focus on PPG data
wfdbbiosppy- formerly here:
py-ecg-detectorssleepecg
Benchmarking ECG libraries
When choosing one of these options, you may consider a number of factors, such as computation speed, peak detection accuracy and code maturity. In this post, we will compare segmentation performance and speed of the packages listed above.
Existing benchmarks
Note that this post is primarily concerned with usability rather than the algorithmic details behind the different implementations. Many QRS detection methods have been introduced in scientific literature, which I will not cover in more detail here. There are several papers benchmarking accuracy and robustness of the specific algorithms — for example Liu et al. (2018)3 or Porr & Howell (2019)4. For libraries that implement multiple algorithms, I am using only one specific method – the modified EngZee algorithm by Lourenço et al. 5, which is one of the most accurate algorithms, according to Porr & Howell. Also note that there is a lack of standards in the evaluation of QRS detectors. There is no consensus on which databases to use and which metrics to report. Results may vary significantly between datasets, which is also highlighted by Porr & Howell 4.
While writing up this post, I found that this sort of benchmark has already
been done by the maintainers of sleepecg
here.
Still, this post holds additional value, as I am using a different dataset and
provide an unbiased analysis.
Comparison setup
The following sections describe how the benchmark results were obtained. If you are just interested in the results, you can skip to the next section. The actual benchmarking code is described in the last section.
Benchmarking dataset
For this comparison of R peak detectors, I am using the MIT-BIH Polysomnographic Database6 from PhysioNet7. It contains overnight recordings of several physiologic signals from 16 subjects. I chose this dataset for a number of reasons. First, it provides annotated ECG signals of varying quality due to the unconstraint setup with sleeping patients. Second, the recorded signals span several hours, clearly highlighting the need for efficient algorithm implementations. Finally, the dataset is not particularly large in size, which makes it less cumbersome to handle and the benchmark easy to reproduce. You can download the dataset (~630MB) here.
Comparing detections and reference annotations
Comparing algorithm outputs with expert annotations is not as trivial as it may seem at first glance. The challenge lies with finding a correspondence between detected and actual peaks. This includes defining an acceptable degree of misalignment, which strongly influences the resulting metrics.
Once peaks are matched, one can determine the number of correct detections (true positives), the number of wrongly labeled peaks (false positives) and the number of missed peaks (false negatives). Derived from these raw numbers, more useful, normalized metrics can be calculated:
- sensitivity / recall: percentage of true peaks correctly identified – how many of the annotated peaks did we find?
- positive predictivity / precision: percentage of correct peaks among detections – how many detected peaks are actually correct?
Some of the libraries listed earlier, provide functions to compare ECG
segmentations. Notably, BioSPPy’s compare_segmentation,
WFDB’s compare_annotations and
sleepecg’s compare_heartbeats can be used to
match detected peaks with reference annotations and calculate useful metrics.
Actual QRS annotations
The peak annotations provided with PhysioNet datasets may contain not only QRS peaks but also some additional information irrelevant for a comparison of QRS detectors. These labels include for example, Signal quality change or Rhythm change. It is not completely straightforward to obtain only QRS annotations from WFDB annotation objects. However, I found a way, that does not involve hard-coding a list of QRS annotation labels. Instead, we can leverage a few less well documented parts of the WFDB package.
|
|
Below is the first part of the annotation label table, which gives us insights into the meaning of each annotation code. A description of these labels is also documented here.
| Value - Symbol | Description |
|---|---|
| 0 | Not an actual annotation |
| 1 - N | Normal beat |
| 2 - L | Left bundle branch block beat |
| 3 - R | Right bundle branch block beat |
| 4 - a | Aberrated atrial premature beat |
Benchmark results
The benchmark shows that (aside from heartpy, which was not specifically
designed for ECG), all available QRS detectors achieve solid accuracy.
Larger differences are found in terms of execution duration.
You can explore the benchmark results yourself here, or read further below.
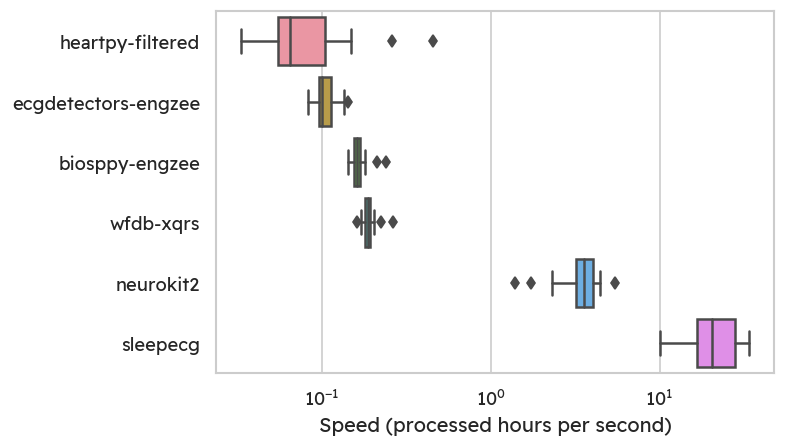
Speed
As an accessible normalized metric, we can look at the hours of signal
processed per second. The MIT-BIH sleep dataset6 was
specifically chosen to highlight the need for fast computations.
Appropriately, the fastest QRS detector is provided with the sleep-centric
sleepecg package.
With its C-based implementation of the popular Pan & Tompkins
algorithm8, I can process roughly 20 hours in one
second on my (consumer-grade) laptop.
In contrast, the third fastest method is already around 90-100 times slower.
Notice the logarithmic scale on the plot below.

Accuracy
In terms of detection accuracy, the sleepecg method is very good,
but not the best.
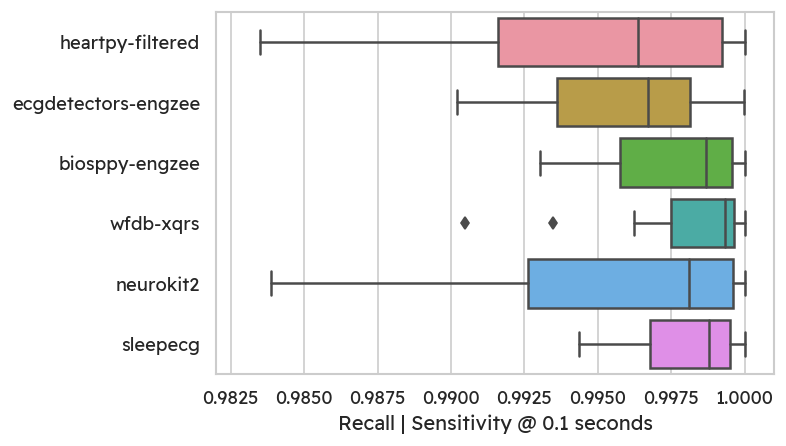
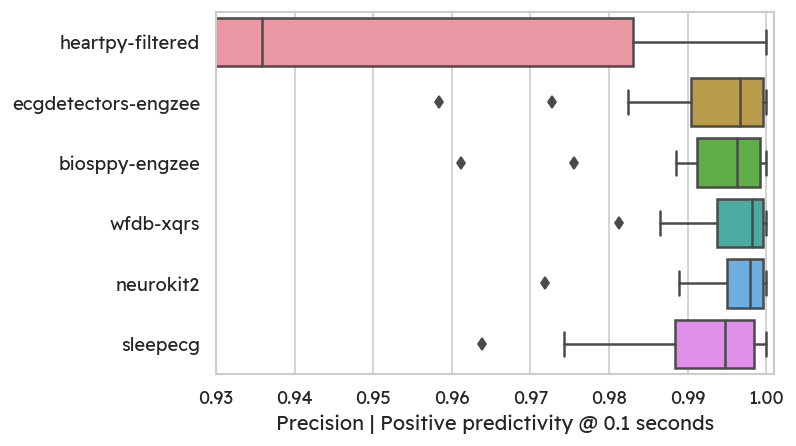
Allowing a misalignment of 100 milliseconds, we can look at recall/sensitivity
and precision.
The highest average recall and precision are achieved by WFDB’s XQRS
detector (99.81% recall, 99.58% precision).
Most methods achieve good recall, which means that only few true peaks are
missed:

On the flipside, some methods (especially heartpy) detect more false
positives, leading to lower precision.
Notably, neurokit has excellent precision. Most detectors produce well below
1% of false peaks for most subjects.

Conclusion
This benchmark of different ECG detection libraries has shown that there are
indeed a variety of viable options to choose from. Depending on your specific
needs, you may however prefer one over others.
The highest accuracy (at least on the MIT-BIH polysomnographic dataset) is
achieved with WFDB’s XQRS detector.
On the other hand, there is a clear winner in terms of speed:
sleepecg.
The C implementation of the Pan & Tompkins algorithm8 is blazingly
fast, processing the same amount of data roughly 100 times faster than WFDB’s XQRS.
NeuroKit’s QRS detection methods are
also a solid choice. The default method is accurate and fast.
As a bonus, NeuroKit also comes with many signal processing utility functions,
that can make your coding life a lot easier.
To summarize:
- Looking for high accuracy? ➜
WFDB(most other libraries are comparable, though) - Looking for speed? ➜
sleepecg - Looking for additional functionality?
➜
NeuroKit
Note that these results only truly apply to the MIT-BIH Polysomnographic Database. With other datasets, different ECG lead placements or different signal to noise ratios, the achieved accuracies may vary.
Appendix: Benchmarking code
You can find the complete benchmarking code on GitHub.
The following section highlights some of the important steps.
We define a dictionary that maps method names to callable functions with a
unified signature
(detector(ecg: ArrayLike, sampling_rate: int) -> np.ndarray).
|
|
|
|
The main function leverages the joblib library for parallelized
computations and caching results.
In the past, I had saved outputs manually and used an if-else block to
either re-compute or read results from disk.
Finally, I found that this sort of caching has been done already - and better -
in joblib.
You can use the joblib.Memory class to define a location on disk to store
function results.
Similar to functools' caching, the decorated function is re-run only with
unseen arguments.
|
|
The resulting data frame contains one row for each detector and gives us the execution time, as well as precision and recall for different acceptable misalignments (0.05, 0.1 and 0.15 seconds).
(References)
-
P. Kamga, R. Mostafa, and S. Zafar, “The Use of Wearable ECG Devices in the Clinical Setting: a Review,” Current Emergency and Hospital Medicine Reports, vol. 10, pp. 67–72, 2022, doi:10.1007/s40138-022-00248-x ↩︎
-
C. Xie, L. McCullum, A. Johnson, T. Pollard, B. Gow, and B. Moody, “Waveform Database Software Package (WFDB) for Python (version 4.1.0),” PhysioNet, 2023, doi:10.13026/9njx-6322. ↩︎
-
F. Liu et al., “Performance Analysis of Ten Common QRS Detectors on Different ECG Application Cases,” Journal of Healthcare Engineering, vol. 2018, 2018, doi:10.1155/2018/9050812. ↩︎
-
B. Porr and L. Howell, “R-peak detector stress test with a new noisy ECG database reveals significant performance differences amongst popular detectors,” bioRxiv, pp. 1–27, 2019, doi:10.1101/722397. ↩︎
-
A. Lourenço, H. Silva, P. Leite, R. Lourenço, and A. L. N. Fred, “Real Time Electrocardiogram Segmentation for Finger based ECG Biometrics.,” in Biosignals, 2012, pp. 49–54. ↩︎
-
Y. Ichimaru and G. B. Moody, “Development of the polysomnographic database on CD-ROM,” Psychiatry and Clinical Neurosciences, vol. 53, no. 2, pp. 175–177, 1999, doi:10.1046/j.1440-1819.1999.00527.x. ↩︎
-
A. L. Goldberger et al., “PhysioBank, PhysioToolkit, and PhysioNet: Components of a New Research Resource for Complex Physiologic Signals,” Circulation, vol. 101, no. 23, pp. e215–e220, 2000, doi:10.1161/01.CIR.101.23.e215. ↩︎
-
J. Pan and W. J. Tompkins, “A Real-Time QRS Detection Algorithm,” IEEE Transactions on Biomedical Engineering, vol. BME-32, no. 3, pp. 230–236, 1985, doi:10.1109/TBME.1985.325532. ↩︎


